
Lab Gas System
This page provides access to the real-time gas monitoring dashboard for the Mackinder Lab growth chambers. The system continuously measures CO₂ (and O₂ on selected chambers) using a network of ESP32-based sensors connected to a central Raspberry Pi hub.
The dashboard shows up to 14 days of historical data across all active sensors. It is hosted on Grafana Cloud and requires no login to view.
View Example Dashboard Screenshot
 {:
{:
Figure 1: Example screenshot of the live dashboard.}.*
About the system
- CO₂ sensors use SenseAir K30 NDIR sensors — accurate, long-lived optical sensors that do not require periodic replacement.
- O₂ sensors (selected chambers) use DFRobot SEN0322 electrochemical sensors.
- Readings are pushed automatically to the dashboard every 5 seconds (default interval, configurable per sensor).
- Data is stored indefinitely on each sensor’s local SD card in monthly CSV files, independent of the dashboard.
Notes for lab members
The dashboard link opens in a new tab. If the dashboard shows no data for a sensor, the most likely cause is that the sensor has lost its connection to the Raspberry Pi hub — check that the Pi is powered on and that the sensor’s indicator light is active.
For calibration procedures, sensor settings, or downloading raw CSV data, connect directly to the individual sensor’s WiFi network and navigate to 192.168.4.1. Full documentation is available below.
More information
View Gas System Schematic
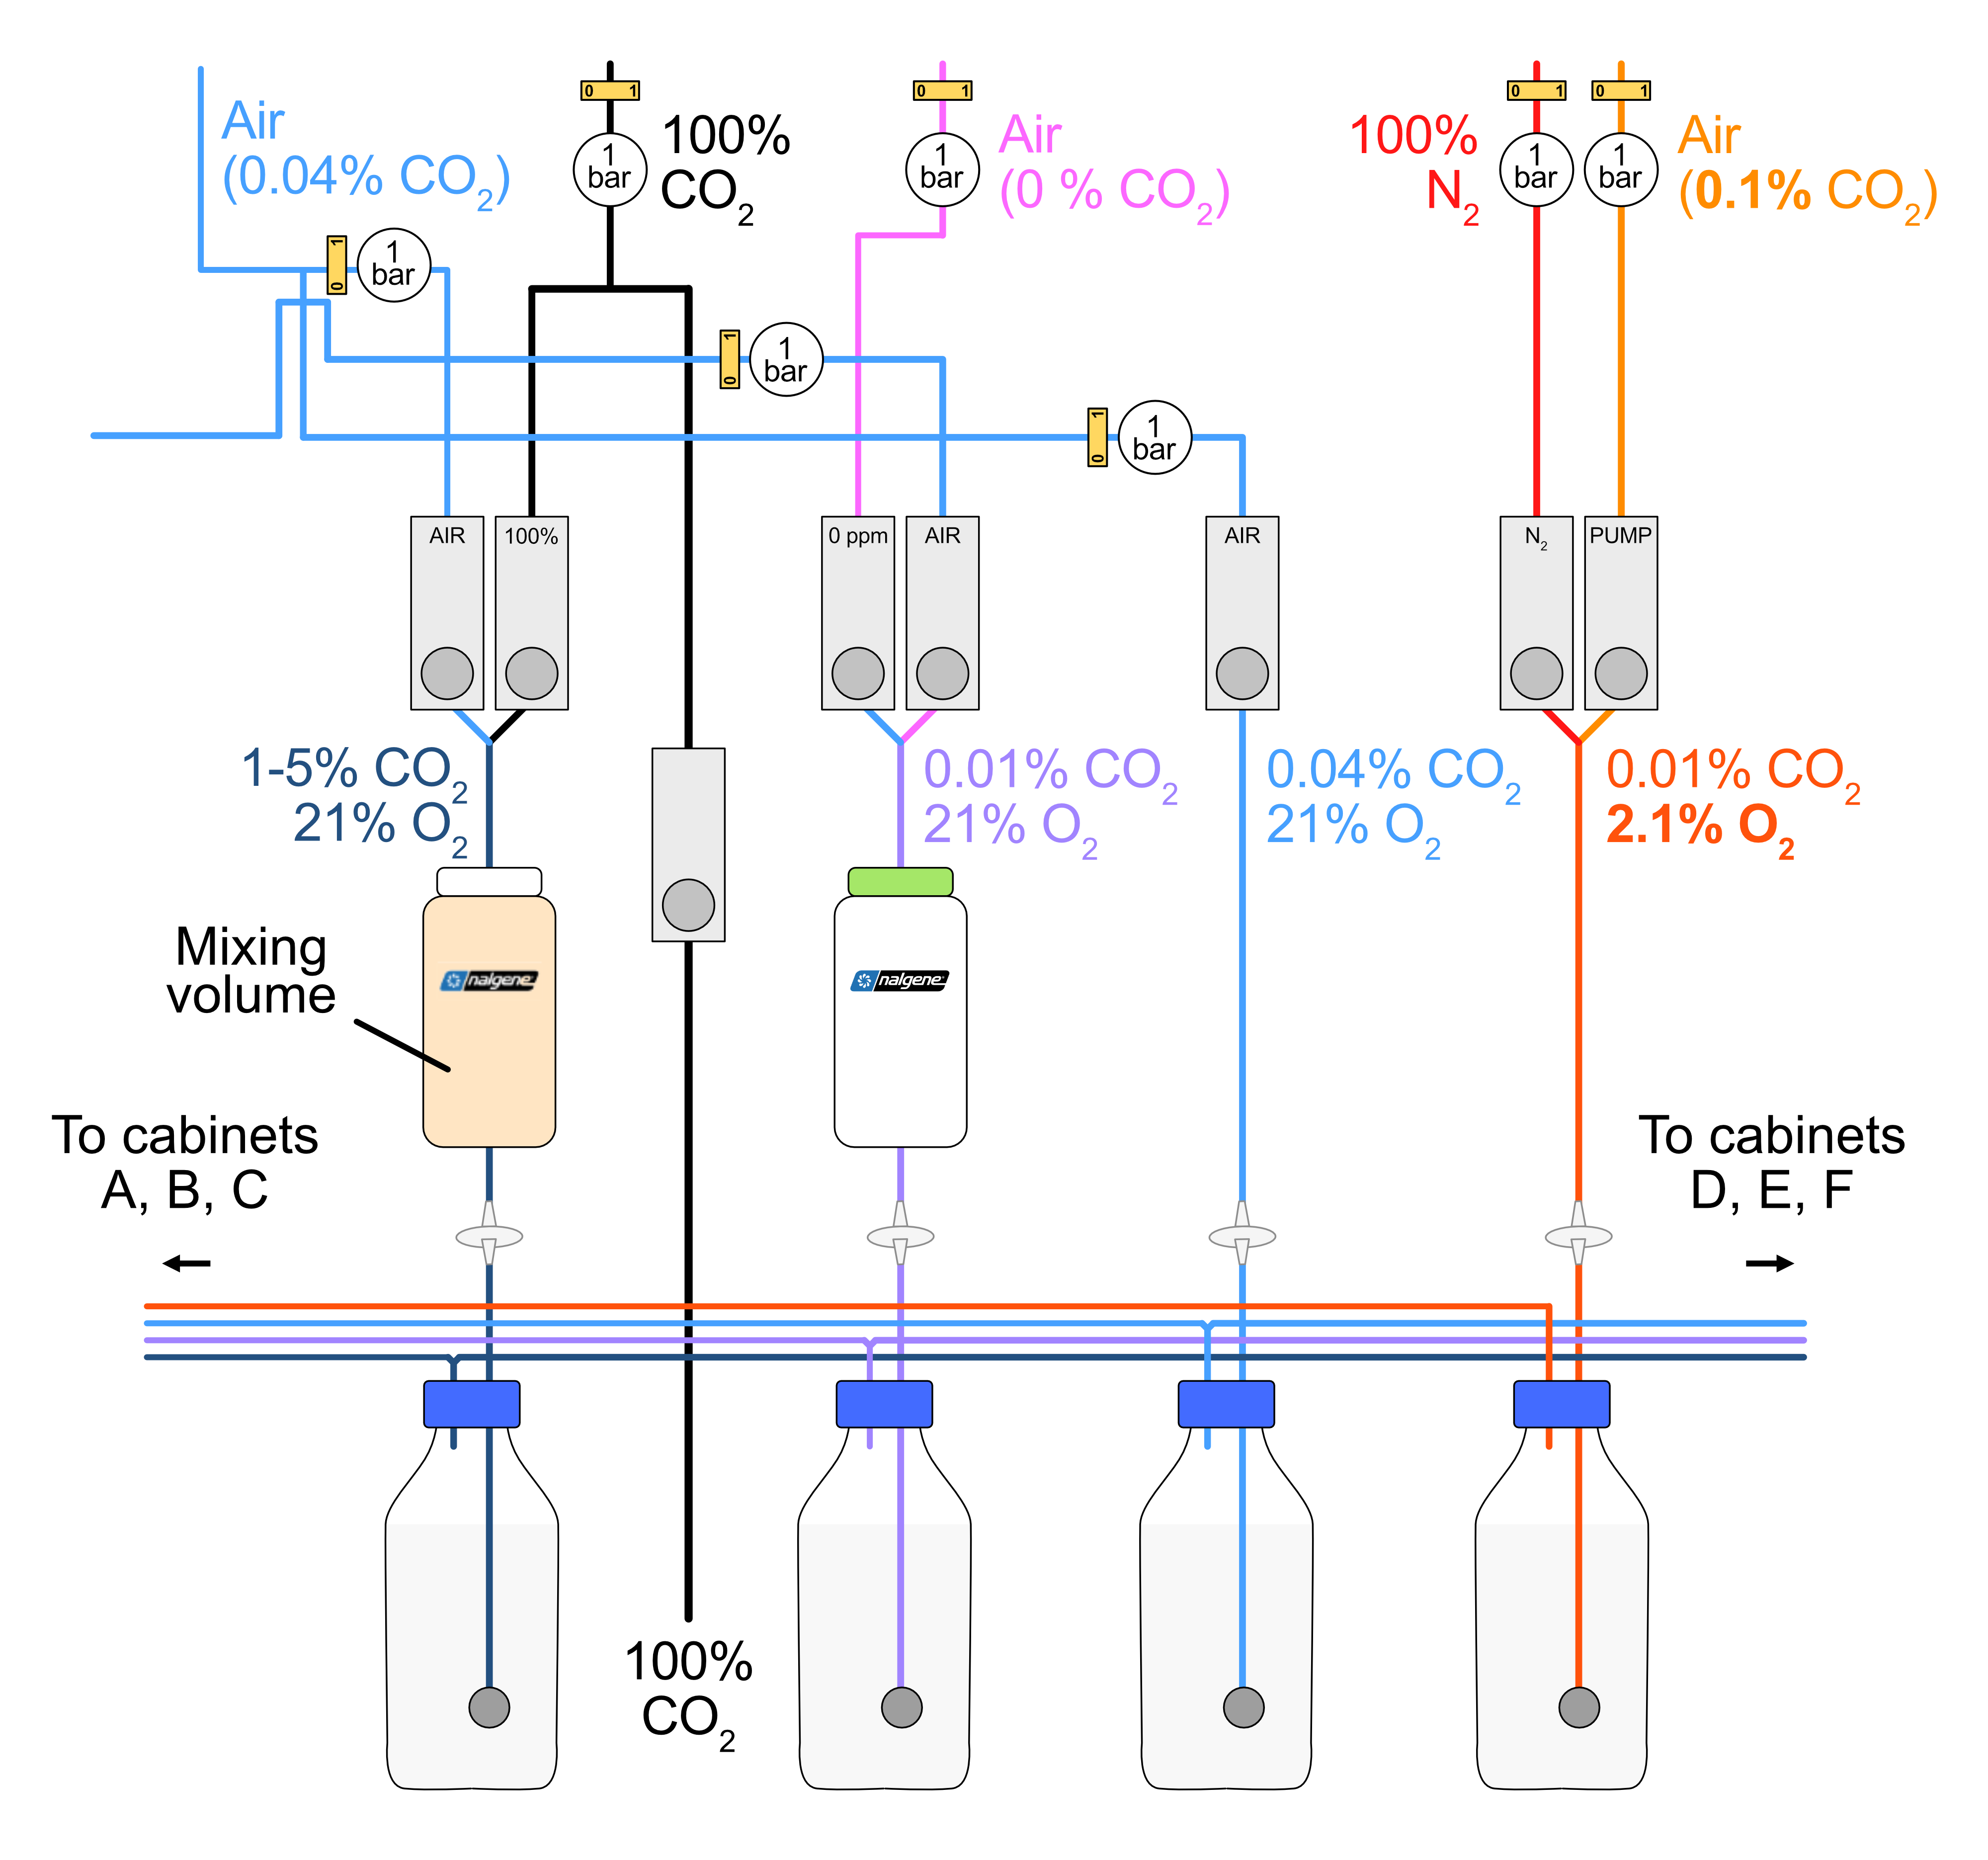
Figure 1: Schematic of the gas system in the Mackinder algae house.
View Monitoring System Documentation
1. System Overview
This document describes the operation, maintenance, and calibration of the laboratory gas monitoring network. The system continuously measures carbon dioxide (CO₂) concentrations, and optionally oxygen (O₂), across multiple growth chambers and locations, with data accessible both locally at each sensor and remotely via a centralised dashboard.
1.1 System Architecture
The monitoring network consists of three tiers:
Individual sensors — ESP32-based microcontrollers with K30 CO₂ sensors (and, on some units, electrochemical O₂ sensors) installed in growth chambers, plus two USB-connected gas analysers (a Minir-5 and a K30 1%) monitoring the mixing bottle supplies to the chamber manifolds.
A central Raspberry Pi hub, connected to the university wired network, which receives data from all sensors and forwards it to a cloud dashboard.
A Grafana Cloud dashboard, accessible from anywhere, providing up to 14 days of historical data across all sensors simultaneously. A dedicated laptop in the growth room displays this dashboard at all times, giving a live overview of all sensors without requiring a personal device.
The system has three types of sensor unit:
| CO₂-only sensors | Measure carbon dioxide concentration (ppm). Suitable for standard growth chambers. |
| CO₂ + O₂ sensors | Measure both CO₂ (ppm) and O₂ (%). Suitable for experiments where both values are important. |
| Mixing bottle monitors | Two USB-connected analysers monitoring the gas mixing bottles that supply the chamber manifolds: a Minir-5 (orange bottle, 1–5% CO₂ mix, range up to 50,000 ppm) and a K30 (clear bottle, ambient/low CO₂ mix, range up to 10,000 ppm). Connected to a dedicated Windows laptop via USB; data pushed to Grafana via the GasMonitor WiFi network. |
1.2 Data Flow
Under normal operation, each sensor connects to the Raspberry Pi’s WiFi network (SSID: GasMonitor) and pushes readings at the configured interval (default 5s). The Raspberry Pi stores readings locally in InfluxDB and simultaneously forwards them to Grafana Cloud. The sensors also maintain their own local web interface, accessible by connecting directly to the sensor’s individual WiFi hotspot.
Note: The Grafana Cloud dashboard is a monitoring tool only and is not a primary data storage platform. For long-term records and offline analysis, CSV log files should be downloaded directly from each sensor’s SD card. Grafana retains the last 14 days of data.
2. Sensor Hardware
2.1 CO₂ Sensor (K30)
All units use the SenseAir K30 non-dispersive infrared (NDIR) CO₂ sensor [030-8-0011]. NDIR sensors measure CO₂ by the absorption of infrared light at a wavelength specific to CO₂ molecules. Key properties:
Range: 0–10,000 ppm (extended range K30)
Measurement principle: NDIR — optical, not electrochemical
Lifetime: Indefinite under normal conditions. The sensor does not have a consumable element and does not need to be replaced.
Warm-up time: The sensor requires approximately 10 seconds to stabilise after power-on. During this period the display shows a countdown and readings are not recorded.
Automatic Baseline Correction (ABC): Disabled on these units. ABC assumes the sensor is exposed to fresh outdoor air (~400 ppm) for at least 1 hour every 8 days; this assumption is invalid in sealed growth chambers. Disabling ABC prevents the sensor from drifting based on incorrect assumptions about the environment.
2.2 O₂ Sensor (SEN0322, CO₂/O₂ units only)
Combined units include a DFRobot SEN0322 electrochemical oxygen sensor. Key properties:
Range: 0–25% O₂
Measurement principle: Electrochemical — the sensor contains a consumable electrochemical cell that is slowly depleted over time.
Lifetime: Approximately 2 years from manufacture/first use. After this period the sensor must be replaced. Replacement sensors are available from DFRobot and other suppliers at low cost.
Calibration: Factory-calibrated to ambient air (20.9% O₂). A manual calibration button on the back of the device allows recalibration to fresh outdoor air if needed. The O₂ sensor does not need to be recalibrated via the web interface.
Note: Monitor the O₂ readings over time. If values begin to drift significantly from expected values or become unstable, this may indicate the electrochemical cell is nearing the end of its life.
2.3 Storage
Each sensor is equipped with an SD card for local data logging. Log files are written in CSV format, split by calendar month (e.g. 2026-03.csv). Storage capacity:
| SD card size | 16 or 32 GB (onboard flash; external SD for logs) |
| Log file format | CSV, one file per calendar month |
| Storage capacity | Greater than 20 years of continuous logging at 5-second intervals |
| Data retention | Indefinite — files are never automatically deleted |
2.4 Mixing Bottle Gas Analysers
Two additional gas analysers are installed on the mixing bottles that supply the downstream chamber manifolds. These are connected via USB to a dedicated Windows laptop in the growth room and push readings to the Grafana dashboard via the GasMonitor WiFi network. The GasLab software previously used to read these sensors is no longer required — data collection and display is handled entirely by the monitoring system.
The two analysers are:
| Minir-5 (orange bottle) | Monitors the 1–5% CO₂ mixing bottle supply. Range: 0–50,000 ppm. COM3, USB connection. Displayed in Grafana in orange. Model: Minir-5 CM-40330 GC-0023. |
| K30 1% (clear bottle) | Monitors the ambient/low CO₂ mixing bottle supply (the same 0–10,000 ppm K30 sensor as used in the chamber units). COM4, USB connection. Displayed in Grafana in clear/white. Both mixing bottle sensors appear at the top of the Grafana dashboard, colour-coded to match their respective bottle colours. |
3. Time Synchronisation
The sensor hardware does not have a real-time clock (RTC). This means that when a sensor is restarted, it has no knowledge of the current date and time. Time must be provided by an external source before accurate timestamping of log files can begin.
3.1 Automatic Synchronisation via Raspberry Pi
Under normal operation, when the sensor successfully connects to the Raspberry Pi’s WiFi network at startup, the Raspberry Pi automatically provides the current Unix time to the sensor. This process is transparent to the user — no action is required. The timestamp is also saved to the SD card so that if the sensor is restarted and reconnects to the Pi, the saved time is used immediately.
3.2 Manual Synchronisation (Fallback)
If the sensor fails to connect to the Raspberry Pi — for example if the Pi is offline or the sensor is being used in a different location — the sensor will display a splash screen with the following message and instructions:
TIME SYNC REQUIRED 1. Connect to WiFi: [sensor SSID] 2. Open in browser: 192.168.4.1
To synchronise the time manually:
Connect your phone, laptop, or tablet to the sensor’s individual WiFi network (the SSID is labelled on the device or visible in the device settings).
Open a web browser and navigate to 192.168.4.1.
The page will load and the time will be automatically synchronised from your device. Normal operation will begin immediately.
Note: During the period before time synchronisation, measurements are still recorded to a fallback log file on the SD card. Once time is synchronised, this fallback data is automatically backdated and merged into the correct monthly log file. No data is lost.
4. Local Sensor Web Interface
Each sensor hosts its own web dashboard, accessible by connecting to the sensor’s individual WiFi access point. This interface provides real-time readings, graphs, calibration tools, settings management, and log file downloads.
4.1 Connecting to the Sensor
On your device (phone, laptop, tablet), open WiFi settings.
Connect to the sensor’s WiFi network. The SSID is typically the device name (e.g. “Bournemouth”). The password is printed on the device or available in the network settings page.
Open a browser and navigate to 192.168.4.1.
4.2 Dashboard Overview
The main dashboard displays:
Current CO₂ reading in ppm, with a trend arrow indicating whether the value is rising, stable, or falling relative to the previous reading.
Current O₂ reading in % (combined units only), with trend arrow.
A sparkline graph showing recent measurement history for the selected graph window.
4.3 Historical Graph
The web interface includes a full-resolution interactive graph of CO₂ (and O₂ on combined units) over the selected time window. The graph window is configurable in the Settings page and can be set from 1 minute up to 96 hours. Up to 10,000 readings are stored in device memory and available for graphing; older readings remain on the SD card but are not shown in the live graph.
Note: The graph x-axis shows real times (HH:MM format) when the device has been time-synchronised, making it straightforward to correlate readings with experimental events.
4.4 Settings
The Settings page allows the following parameters to be configured:
| Graph window | The time period shown on the device display sparkline and web graph. Options: 1 min to 96 hours. |
| Read interval | How frequently the sensor takes a measurement. Options: 1s to 30 minutes. Shorter intervals give more detail but fill the SD card faster (though capacity exceeds 20 years even at 5-second intervals). |
| Device name / Sensor ID | The name shown on the device screen and used as the sensor identifier in the Grafana Cloud dashboard. Change this to identify the sensor uniquely (e.g. by chamber name or location). |
| Location | A descriptive location tag attached to all data pushed to the Grafana dashboard. |
| WiFi SSID and password | The credentials for the sensor’s own WiFi access point. Change these if the default credentials are not suitable. Note: a reboot is required for WiFi changes to take effect. |
| Display flag | A small flag displayed on the device screen. Cosmetic only. |
⚠ Warning: Changing the WiFi SSID or password will disconnect you from the sensor immediately after saving. Reconnect using the new credentials. Make a note of any changes before saving.
4.5 Log File Management
The Logs section of the web interface lists all CSV log files stored on the SD card, one per calendar month. From here you can:
Download individual monthly CSV files for offline analysis.
Delete log files (password protected to prevent accidental deletion).
CSV files contain the following columns:
| datetime | ISO 8601 timestamp (YYYY-MM-DD HH:MM:SS), UTC |
| uptime_s | Seconds since device last restarted |
| co2_ppm | CO₂ concentration in parts per million |
| o2_pct | O₂ percentage (combined units only) |
4.6 Calibration Log
The web interface displays the three most recent calibration events, including the calibration type (400 ppm or 0 ppm), the date and time performed, and the CO₂ reading at the time of calibration. A full calibration log is stored on the SD card as cal_log.csv.
5. Remote Monitoring via Grafana Cloud
The Grafana Cloud dashboard provides a unified view of all sensors simultaneously, accessible from anywhere without needing to connect to individual sensor access points.
5.1 Laptop Display (Growth Room)
A dedicated laptop in the growth room displays the Grafana dashboard full-screen at all times. This provides a live overview of all sensors without requiring any personal device. Users can interact with the dashboard on the laptop to change the display time window, scroll through individual sensor panels, or zoom in on specific readings. No login is required to view the dashboard.
The two mixing bottle sensors (Minir-5 and K30 1%) appear at the top of the dashboard, colour-coded to match their bottle colours (orange and clear respectively). Chamber sensors appear below. The laptop also runs the Python scripts that collect data from the two USB-connected mixing bottle analysers — these start automatically on login and do not require any user action.
5.2 Data Retention
Grafana Cloud retains the last 14 days of data for each sensor. It is not a long-term archive — for permanent records, CSV files must be downloaded from the individual sensors’ SD cards.
5.3 Data Availability
Data appears in Grafana only when the sensor is connected to the Raspberry Pi’s GasMonitor WiFi network and the Raspberry Pi has internet access. If a sensor is running in standalone mode (connected directly to a phone or laptop for time sync only), its data will not appear in Grafana until it reconnects to the Pi network. All data is still logged locally to the SD card regardless of Pi connectivity.
5.4 Sensor Identification
Each sensor appears in Grafana under its configured Device Name / Sensor ID and the location of the sensor (see Section 4.4). It is important that each sensor has a unique, descriptive name so that readings from different chambers can be distinguished on the dashboard. The Location tag provides additional context.
5.5 Installing the Dashboard as an App
The dashboard can be installed as a standalone app on phones and laptops for quick access without opening a browser. This is recommended for regular users.
Chrome (desktop or Android)
Open the Grafana dashboard URL in Chrome.
Click the three-dot menu (⋮) in the top-right corner of Chrome.
Select “Cast, save and share” → “Install as app”.
Click “Install” in the confirmation dialog. The dashboard will appear as an app icon on your desktop or home screen.
Safari (iPhone / iPad)
Open the Grafana dashboard URL in Safari.
Tap the Share button (the square with an arrow pointing upward) at the bottom of the screen.
Scroll down and tap “Add to Home Screen”.
Tap “Add”. The dashboard opens as a full-screen web app from your home screen without browser toolbars.
6. Calibration
6.1 When to Calibrate
The K30 sensor should be calibrated:
When first deployed.
If readings appear consistently offset from expected values.
After long periods of storage.
Periodically as part of routine quality control (frequency depends on application requirements).
The O₂ sensor does not require calibration via the web interface. If recalibration is needed, use the physical button on the back of the device while the sensor is exposed to fresh outdoor air.
6.2 Calibration Methods for CO₂ (K30)
Two calibration points are available via the web interface:
6.2.1 Zero Calibration (0 ppm)
This is generally the more reliable of the two calibration options and is recommended as the primary calibration method. The sensor is exposed to a gas known to contain 0 ppm CO₂, and the reading is set to zero.
Suitable gas sources available in the growth room:
Pure nitrogen (N₂)
The 21% O₂ / 79% N₂ (0 ppm CO₂) gas mix plumbed into the growth room
Procedure:
Connect the appropriate gas supply to a sealed enclosure or bag large enough to place the sensor in.
Allow the sensor to equilibrate for at least 2–3 minutes until the reading stabilises.
Connect to the sensor’s local web interface (192.168.4.1).
Navigate to the Calibrate section and press “0 ppm”.
Wait for calibration to complete (approximately 10 seconds). The sensor will display “Done” when finished.
6.2.2 400 ppm Calibration (Ambient Air Reference)
The sensor is exposed to a gas known to contain 400 ppm CO₂ and the reading is set to this value. This mimics the concentration of CO₂ in clean outdoor ambient air.
⚠ Warning: The compressed air line in the department takes gas from outside and uses it after desiccation. While the CO₂ concentration of this supply averages approximately 400 ppm, it can vary by as much as ±100 ppm depending on time of day (diurnal variation in outdoor CO₂) and the degree of desiccation processing. Using this supply for 400 ppm calibration without first verifying the actual concentration carries a significant risk of introducing calibration error. Use with extreme caution.
Preferred methods for 400 ppm calibration:
Move the sensor outdoors during the day (away from building exhausts and heavy traffic) and allow it to equilibrate for 5–10 minutes in open air, then calibrate. The sensor can be powered from a USB battery pack or laptop connection during this process.
Use a certified CO₂ reference gas cylinder at exactly 400 ppm if available.
Procedure for outdoor calibration:
Power the sensor using a USB battery pack or laptop.
Take the sensor to a suitable outdoor location (away from exhausts, busy roads, or areas with high foot traffic).
Allow the sensor to run for at least 5 minutes until the reading is stable.
Connect to the sensor’s local web interface from your phone.
Navigate to the Calibrate section and press “400 ppm”.
Wait for calibration to complete. The sensor will display “Done” when finished.
Note: Calibration events are automatically recorded with a timestamp and the CO₂ reading at the time of calibration. This log is viewable on the web interface and stored on the SD card for audit purposes.
6.3 Calibration Confirmation
After any calibration, verify the result by checking the reading against a known reference. Allow several minutes for the sensor to stabilise following calibration before taking reference measurements.
6.4 Calibration of Mixing Bottle Analysers (Experienced Users Only)
The Minir-5 and K30 1% mixing bottle analysers are calibrated using dedicated Python GUI tools on the Windows laptop. These tools communicate directly with the sensors over USB and should only be used by experienced users familiar with the calibration procedure. The GasLab software is no longer used or required.
K30 1% Calibration (k30_calibration.py)
The K30 uses the same binary Modbus protocol as the chamber sensors. The calibration tool provides two fixed calibration points: 0 ppm (using N₂ or zero gas) and 400 ppm (outdoor ambient air). The same cautions regarding the departmental compressed air line apply (see Section 6.2.2).
Procedure:
Stop the k30_pusher.py data collection script (close its terminal window) to free the COM4 serial port.
Run k30_calibration.py from the scripts folder. Select COM4 and click Connect.
Expose the sensor to the reference gas and wait for the live reading to stabilise (at least 2–5 minutes).
Click the appropriate calibration button (0 ppm or 400 ppm), read the on-screen instructions, and confirm.
After calibration completes, close the calibration tool and restart k30_pusher.py to resume data collection.
Minir-5 Calibration (minir_calibration.py)
The Minir-5 uses an ASCII protocol and can be calibrated to any known concentration, making it suitable for calibration against certified reference gas mixtures at any CO₂ level between 0 and 100,000 ppm. A live reading display and concentration presets (1k, 5k, 10k, 20k, 30k, 50k ppm) are provided in the tool.
Procedure:
Stop minir_pusher.py to free the COM3 serial port.
Run minir_calibration.py. Select COM3 and click Connect.
Connect the reference gas and wait for the reading to stabilise (3–5 minutes).
Enter the exact reference gas concentration in the target field (or use a preset), then click “Calibrate to target concentration” and confirm.
The tool will display the sensor’s confirmed calibration value. If this differs from the target by more than 100 ppm, verify the reference gas concentration before accepting.
Close the calibration tool and restart minir_pusher.py to resume data collection.
7. Troubleshooting
| Symptom | Likely cause and action |
|---|---|
| Splash screen asking to sync time | The sensor did not connect to the Raspberry Pi. Connect to the sensor’s own WiFi and navigate to 192.168.4.1. Time will sync automatically from your device. |
| Sensor not appearing in Grafana | Check the sensor is connected to the GasMonitor WiFi network (Pi indicator dot on device screen should be green/cyan). Also confirm the Raspberry Pi has internet connectivity. |
| CO₂ reading shows ‘Read error’ or ‘CO₂ disconnected’ | The K30 sensor may have a wiring issue or has failed to respond. Power cycle the device. If the error persists, check the K30 cable connection. |
| O₂ reading shows ‘--’ or unavailable | The O₂ sensor may not have been detected at startup (takes up to 10 seconds). Power cycle the device. If it persists after multiple reboots, the sensor may need replacement. |
| Readings appear offset or implausible | The sensor may need calibration. See Section 6. |
| O₂ readings drifting low or unstable | The electrochemical cell may be nearing end of life (~2 years from manufacture). Replace the SEN0322 sensor. |
| Web interface not loading at 192.168.4.1 | Ensure you are connected to the sensor’s own WiFi network and not to GasMonitor or any other network. Disable mobile data on phones if needed. |
| Settings not saved after reboot | Ensure the SD card is present and properly seated. Settings are stored on the SD card; without it, all settings revert to defaults on reboot. |
| Log files missing months of data | Check whether the device was running without time synchronisation during that period — data may be in fallback.csv. If fallback.csv exists on the SD card, it contains readings taken before time was synced and is backdated automatically once sync occurs. |
| Mixing bottle sensors not appearing in Grafana | Check that the Windows laptop is powered on and logged in. The minir_pusher.py and k30_pusher.py scripts start automatically on login — if they were closed, reopen them from the scripts folder. Also confirm the laptop is connected to the GasMonitor WiFi network. |
8. Quick Reference
Sensor network access points
| Raspberry Pi hub WiFi SSID | GasMonitor |
| Raspberry Pi hub WiFi password | *** ask admin *** |
| Individual sensor web interface | Connect to sensor WiFi, then open 192.168.4.1 |
| Grafana Cloud dashboard | https://jamesrbarrett.grafana.net/public-dashboards/2842727a8849425480e023f71c46eba7 |
Key facts
| CO₂ sensor type | SenseAir K30 (NDIR, no consumable element) |
|---|---|
| O₂ sensor type | DFRobot SEN0322 (electrochemical, ~2 year lifetime) |
| O₂ sensor calibration | Physical button on device back (outdoor fresh air only) |
| CO₂ calibration — preferred method | 0 ppm using N₂ or 21%O₂/79%N₂ mix |
| CO₂ calibration — 400 ppm caution | Departmental compressed air varies ±100 ppm; outdoor calibration preferred |
| Data storage | SD card, CSV by month, >20 years capacity at 5s intervals |
| Grafana data retention | 14 days |
| Time sync | Automatic via Pi; manual via phone/laptop browser if Pi unavailable |
End of document