
SEC_Fit
Published:
SEC_Fit is an open-source Python tool designed for the quantitative analysis of analytical Size-Exclusion Chromatography (SEC) data. It allows users to easily fit interactive Gaussian models to overlapping chromatographic peaks, estimate molecular weights based on column calibration standards, and calculate relative species abundance and stoichiometry directly from ÄKTA CSV exports.
View the full documentation and source code on GitHub.
Key Features
- Interactive Peak Fitting: Click directly on your chromatogram to fit Gaussian models to specific peaks or elusive shoulders.
- Advanced Deconvolution: Resolves complex, overlapping peaks using restricted global optimization.
- Quantitative Analysis: Automatically calculates Area Under the Curve (AUC) for relative abundance (%) and estimates oligomeric state (stoichiometry).
- Broad Compatibility: Robustly auto-detects headers, encodings, and injection volumes from messy ÄKTA Go and Purifier CSV exports.
- Configurable Columns: Easily switch between different SEC columns and calibration profiles via a centralized dictionary.
Example SEC Trace
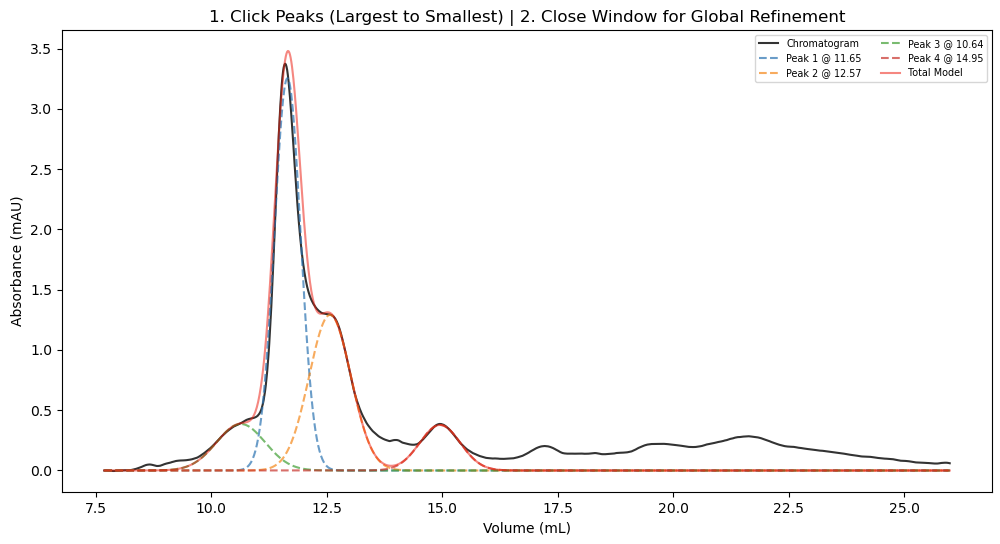
During the interactive selection phase, you can click on the apex of the peaks you wish to analyze:
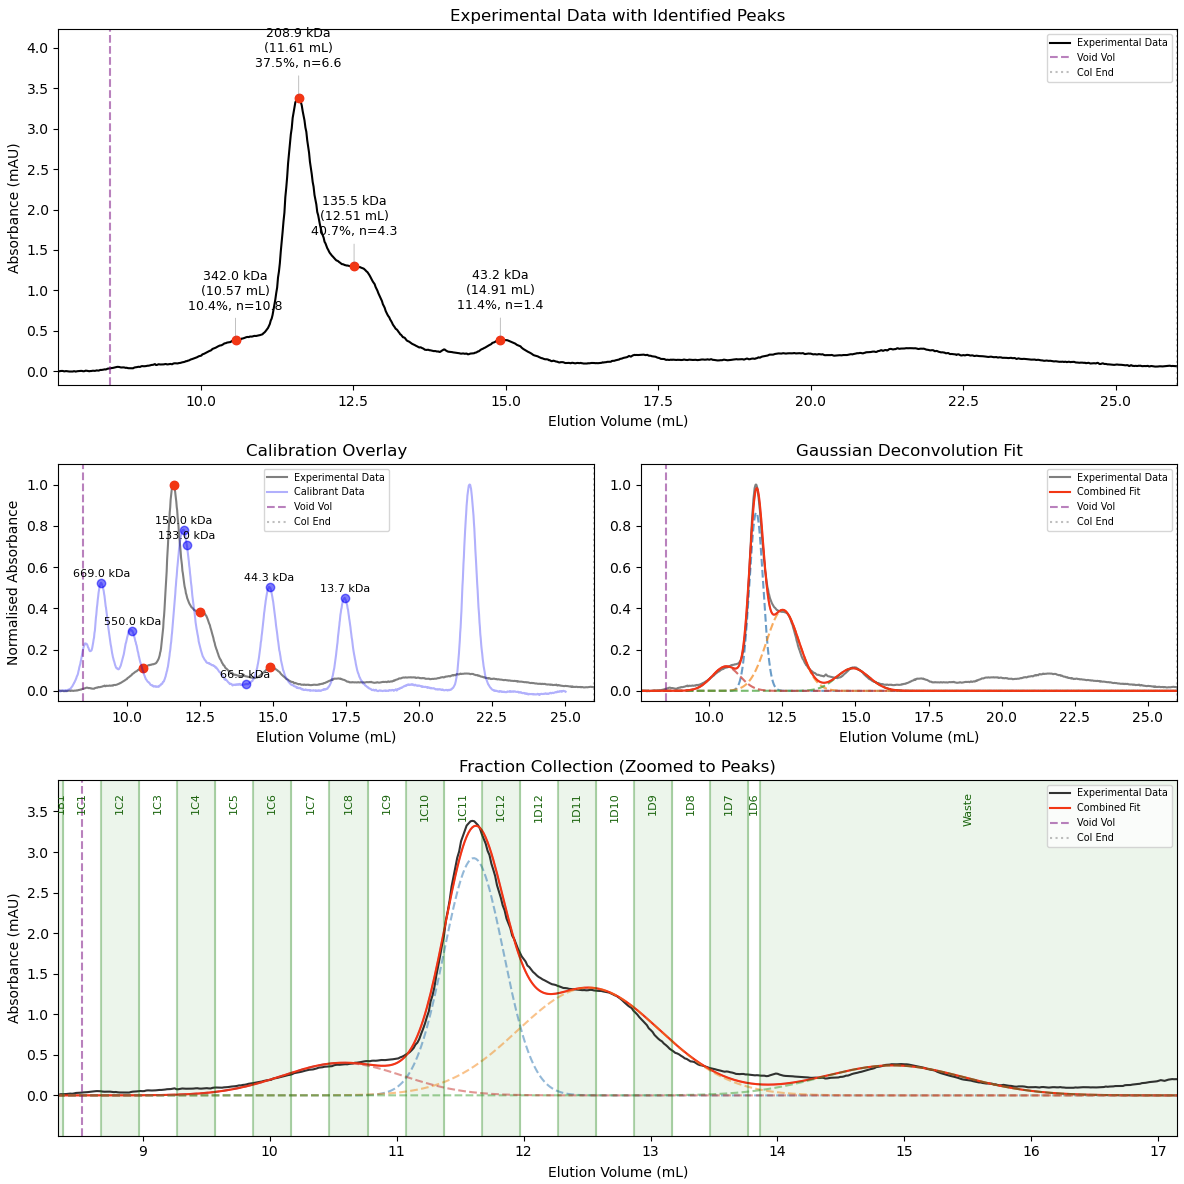
After fitting, the advanced pipeline generates a publication-ready 3-panel plot. This displays the deconvoluted Gaussian models, overlays the calibration standard curve, and annotates the experimental data with mass, elution volume, relative abundance, and calculated stoichiometry:
Usage
SEC_Fit offers two main workflows depending on the complexity of your sample. Run the program directly from your command line on a CSV exported from an ÄKTA system.
For standard analysis (well-separated species):
python main.py trace.csv
For advanced deconvolution (overlapping peaks, abundance, and stoichiometry):
python main_auto.py trace.csv
The program will automatically detect the injection volumes present in the CSV and prompt you to select the correct run and column configuration. It outputs both the visual plots and a _processed_plot.csv containing the raw, baseline-corrected, and individually modeled peak data for easy plotting in external software like GraphPad Prism.